 Demand history can provide forecasters with key insights into current trends, seasonal patterns and the relationships between demand and explanatory variables. Thus, creating forecasts when little or no demand history is available is particularly challenging. In this installment of Forecasting 101 we’ll examine different approaches to creating forecasts when little or no demand history is available.
We’ll be concentrating on cases where the lack of demand history is due to circumstances such as rapidly changing product lines, short life-cycle products or expanding territories/customer bases, and there is a relationship between the items with limited history and other items that the organization forecasts. The article will not cover new product forecasting models designed for new-to-world or new-to-company products.
Create a Forecast History
When confronted with little or no historic demand, one option is to create a “forecast history” for the item (i.e., a surrogate demand history) and then apply a statistical forecasting method to generate the forecast. If you are forecasting numerous items, most of which have substantial demand histories, this approach is attractive in that once you’ve created the forecast history, the item in question can be treated like every other item.
Forecast histories are often used when forecasting replacement products and product line extensions. For example, if your company replaces a current product with a new and improved version, the new version is assigned a new SKU code and needs to be forecasted. The old SKU will no longer be offered. Creating a forecast history which combines the demand history for the old SKU with the demand history (if available) for the new one is very logical and yields a forecast history long enough to support the same modeling approaches used for the old SKU.
Most product replacements and product line extensions are more complicated than the example above, so the “history mapping” required to create the forecast history may need to be more customized.
Work Top-Down
If the item with limited demand history is part of a larger group of items and the group-level demand history is longer, then a top-down approach should be considered. In a top-down approach the group-level data is forecasted and then proportionally allocated to generate lower-level (component) forecasts.
In general, top-down approaches leverage structure that exists in higher-level aggregate data to improve forecasts at lower levels of the forecasting hierarchy. In cases where the demand history at the lower levels is limited, top-down approaches can be particularly effective.
Let’s illustrate this with an example.
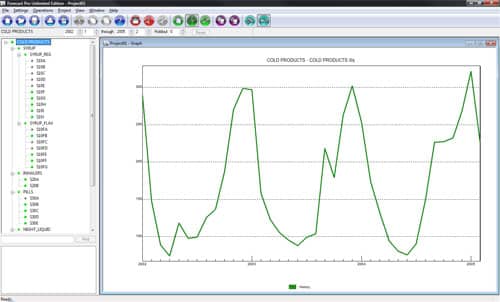
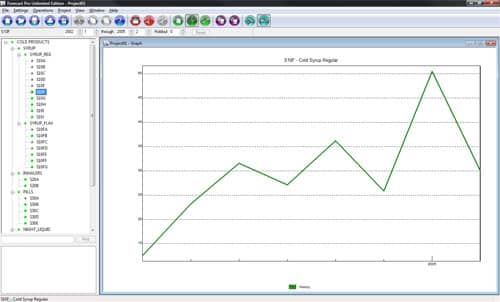
Figure 1 shows monthly sales for a brand of cough syrup. Figure 2 shows monthly sales for a specific SKU. The company assigns a unique SKU number to each flavor-by-bottle-size combination that it produces.
Consider the two graphs. Notice that at the brand level, there is more structure to the data. The seasonal pattern is readily apparent and there is less noise. More than three years of demand history is available at the brand level, while only 8 months of history exists for the recently-introduced SKU.
In this example, the lack of history at the SKU level doesn’t allow you to build a seasonal forecasting model directly from the data. Thus, since cough syrup is clearly a seasonal product, trying to forecast the SKU based solely on its demand history will yield very poor forecasts. On the other hand, a top-down approach allows you to capture the seasonal structure that exists at the group level and introduce it to the SKU-level forecasts via the top-down adjustments.
The example above comes from a company that has a mixture of long and short SKU-level histories. In some industries all SKU-level data will have short histories due to rapidly changing technologies or short product life cycles. These industries often rely heavily on top-down approaches.
Deseasonalize the Data
Time series forecasting models (i.e., models that base the forecasts solely on the past history) often forecast three primary components—level, trend and seasonal pattern. Determining the current level and current trend can be accomplished with limited historic data (say 5 or more data points), however determining the seasonal pattern requires more data. Time series models that automatically capture seasonality typically require a minimum of two years of history and tend to work better with three or more.
One option when working with short demand histories is to remove the seasonal component (deseasonalize the data), create a forecast for the underlying level and trend and then restore the seasonal component (reseasonalize the data and forecasts).
Deseasonalizing the data requires estimating the seasonal pattern. In the case of limited demand history, this cannot be done directly using the history, so it is typically estimated using a different data set that the forecaster feels has a similar seasonal pattern. A common approach is to build a seasonal exponential smoothing model for the “surrogate” data set and use the multiplicative seasonal indexes output as part of the model to deseasonalize the series with limited history.
Summary
Forecasting items with little or no demand history is challenging and requires knowledge of your data and environment. In this article we examined a few of approaches to this challenge including using forecast histories, top-down approaches and deseasonalizing the historic demand.
About the author:


